Our Point of Care Technology Platform
Point of Care Testing
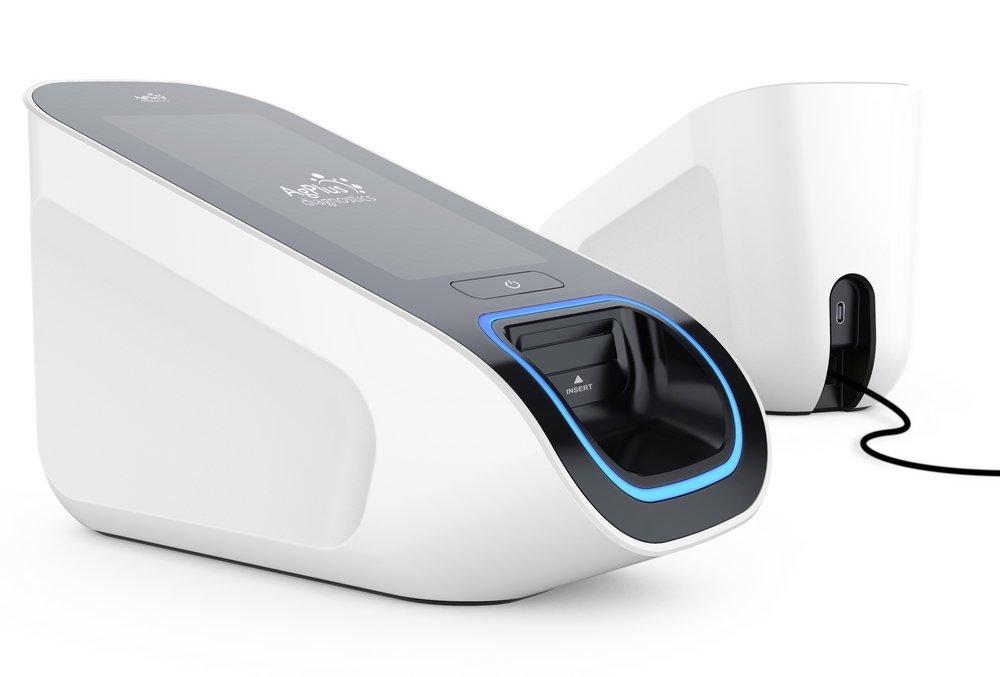
The AgPlus platform consists of a silver assay test cartridge and our handheld Agilis Reader for delivering point of care testing and rapid, quantitative diagnostic results. Our assays are developed as a two-step, single use test that simply requires the addition of the sample on to the cartridge. The assay is then inserted into The Agilis Reader for the analyte measurement and analysis to take place.
our Assay Chemistry
At the core of the AgPlus technology are the reagents for the electrochemical immunoassay. The assay chemistry utilizes silver nanoparticles as its signaling system, which brings greater benefit as detection limits are much improved while sample volumes required for analysis are reduced.
The analyte capture method is based on an “immune complex” being formed in exactly the same manner as in any immunoassay. These reduced sample volumes alongside the improved detection limits has allowed for easier miniaturisation of the system, while giving fully quantitative sample analysis. It is this basic feature that makes the AgPlus technology so universally adaptable.
How The Technology Works
The silver nanoparticles form a charged aggregate due to the presence of ammonium thiocyanate. This is attracted to the electrode under a positive potential. The silver nanoparticle at the electrode is converted to silver ions. The silver ions are measured electro-analytically giving rise to a measurable peak, the area of the peak is proportional to the concentration of molecule being measured.
Magnetic beads and silver nanoparticles are coated with a monoclonal (or polyclonal) antibody against the target analyte. The sample is mixed with the antibody-coated particles and incubated during which time complexes form. After incubation, magnets are activated in the test strip that pulls the complexes formed away from the reaction chamber and the unwanted materials within the incubation chamber to the measurement zone. Once in the measurement area, the silver nanoparticles are cleaved, drawn down to the sensor and measured. The amount of silver particles is directly proportional to the amount of analyte in the sample.
Want to develop an assay with us?
Sample Technical Data
Standard curve and QC for Calprotectin assay in Agilis™ platform
Input Data
ELISA/Agilis comparison for Calprotectin in stool samples a marker for Inflammatory Bowel Disease (IBD)
| STD point | Nominal Concentration ng/mL | Achieved Concentration ng/mL | %RE | Absolute %RE |
|---|---|---|---|---|
| Standard1 | 2 | 2.213 | 9.6 | 9.62 |
| Standard2 | 4 | 3.525 | -13.5 | 13.48 |
| Standard3 | 8 | 9.025 | 11.4 | 11.36 |
| Standard4 | 16 | 14.623 | -9.4 | 9.41 |
| Standard5 | 32 | 36.06 | 11.3 | 11.26 |
| Standard6 | 64 | 59.363 | -7.8 | 7.81 |
| Standard7 | 128 | 137.8 | 7.1 | 7.11 |
| Standard8 | 256 | 227.55 | -12.5 | 12.5 |
| Mean of Absolute RE | 10.32 |
| QC Level | Inassay Nominal Concentration ng/mL | Nominal Concentration µg/g | Back calculated concentration ng/mL | Reported Calprotectin Concentration µg/g | %RE |
|---|---|---|---|---|---|
| Low | 6 | 60 | 8.7 | 87.26 | 31.2 |
| Mid | 22.6 | 226 | 33 | 330.4 | 31.6 |
| High | 192 | 1920 | 343.8 | 3438 | 44.2 |
Output Data
ELISA/Agilis comparison for Calprotectin in stool samples a marker for Inflammatory Bowel Disease (IBD)
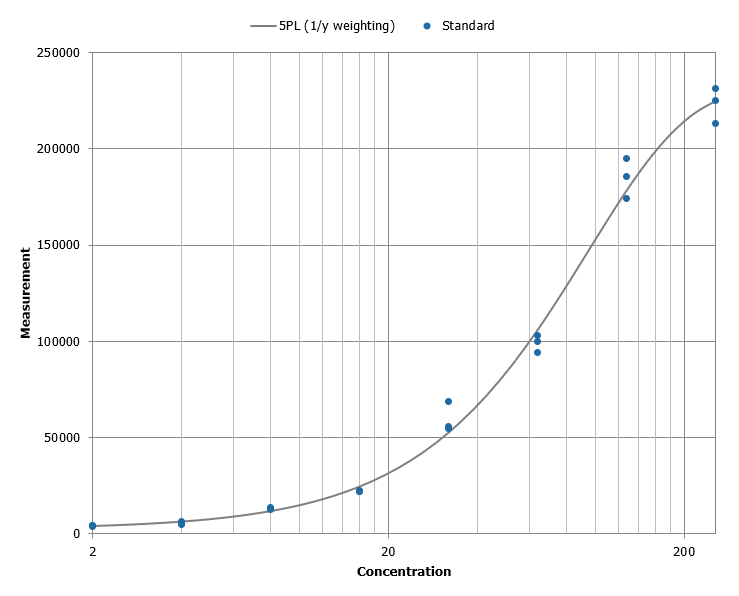
Standard curve and QC for Calprotectin assay in Agilis™ platform
Input Data
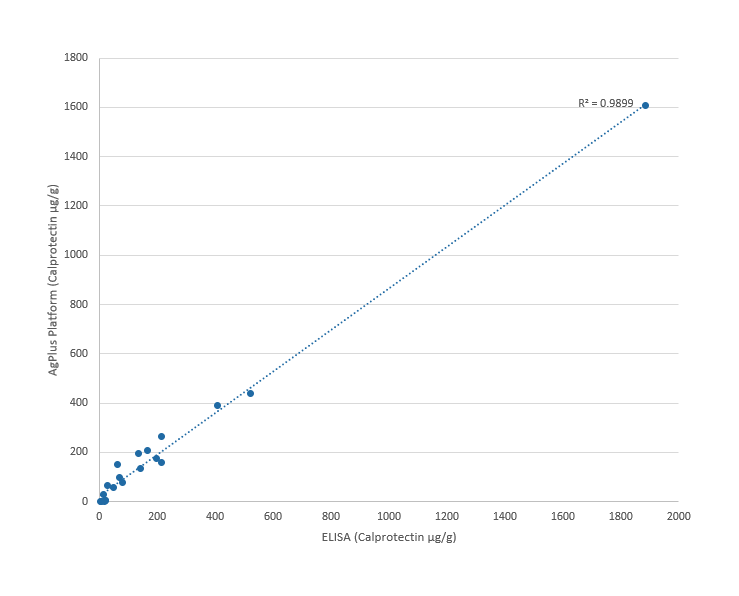
Correlation of ELISA vs AgPlus Platform in detecting feacal calprotectin
| Patient ID | Inassay concentration AgPlus (including DF) ng/mL | AgPlus reported concentration µg/g | ELISA reported concentration µg/g | %RE |
|---|---|---|---|---|
| 1 | 561 | 56.1 | 50.1 | 10.7 |
| 2 | 1499 | 149.9 | 64.2 | 57.2 |
| 3 | 1578 | 157.8 | 215.8 | -36.8 |
| 4 | 2633 | 263.3 | 216 | 18 |
| 5 | 1941 | 194.1 | 136 | 29.9 |
| 6 | 28.77 | 2.877 | 18.3 | -536.1 |
| 7 | 280.2 | 28.02 | 15.9 | 43.3 |
| 8 | 54.02 | 5.402 | 20.6 | -281.3 |
| 9 | 4383 | 438.3 | 521.1 | -18.9 |
| 10 | 2088 | 208.8 | 165 | 21 |
| 11 | 650.9 | 65.09 | 28.2 | 56.7 |
| 12 | 974.6 | 97.46 | 68.3 | 29.9 |
| 13 | 776.5 | 77.65 | 78.6 | -1.2 |
| 14 | 16090 | 1609 | 1885 | -17.2 |
| 15 | – | 0 | 6.8 | – |
| 16 | 3907 | 390.7 | 408 | -4.4 |
| 17 | 1759 | 175.9 | 197.1 | -12.1 |
| 18 | 1362 | 136.2 | 142.5 | -4.6 |
| 19 | 37.83 | 3.783 | 20.9 | -452.5 |
| 20 | – | 0 | 4.8 | – |
Output Data
Correlation of ELISA vs AgPlus Platform in detecting feacal calprotectin
Development & Manufacture
With the help of key partner STI, we will deliver a rapid, ultra-sensitive, fully quantitative Point of Care testing system that will have a wide range of uses both within clinical and non-clinical applications. The benefits will include improving healthcare systems across the UK, making them more adaptable to patients’ needs including becoming more remote, available in an emergency and more responsive in situations involving infectious diseases like Covid-19.
Looking for enhanced competitive edge?
We work with strategic partners to license our patent protected technology. If your organisation is interested in working with us, we’d love to hear from you.
